


Is the stock market overvalued today?
Are you still buying stocks in today's market climate...

To buy or not to buy – that is the question investors ask themselves daily.


When confronted with the above few images, some might inevitably feel uncomfortable (especially if you’ve sat out of the market for whatever reasons).
The 2020 global pandemic scare brought the world to its knees (for a brief moment).
The 2022 recession / hyper-inflation scare as some felt that the US government has lost its way.
The (insert doomsday prophecy here).
The market did not care and continued marching forward and upward.
So, what is the lesson here? Just close your eyes and buy into the S&P 500. Is it the guaranteed way to make easy money? I think the conclusion should be more nuanced than that.
Before we talk about buying into an all-time-highs market, let’s try to evaluate one of the strongest counterarguments – The Market is Overvalued now.
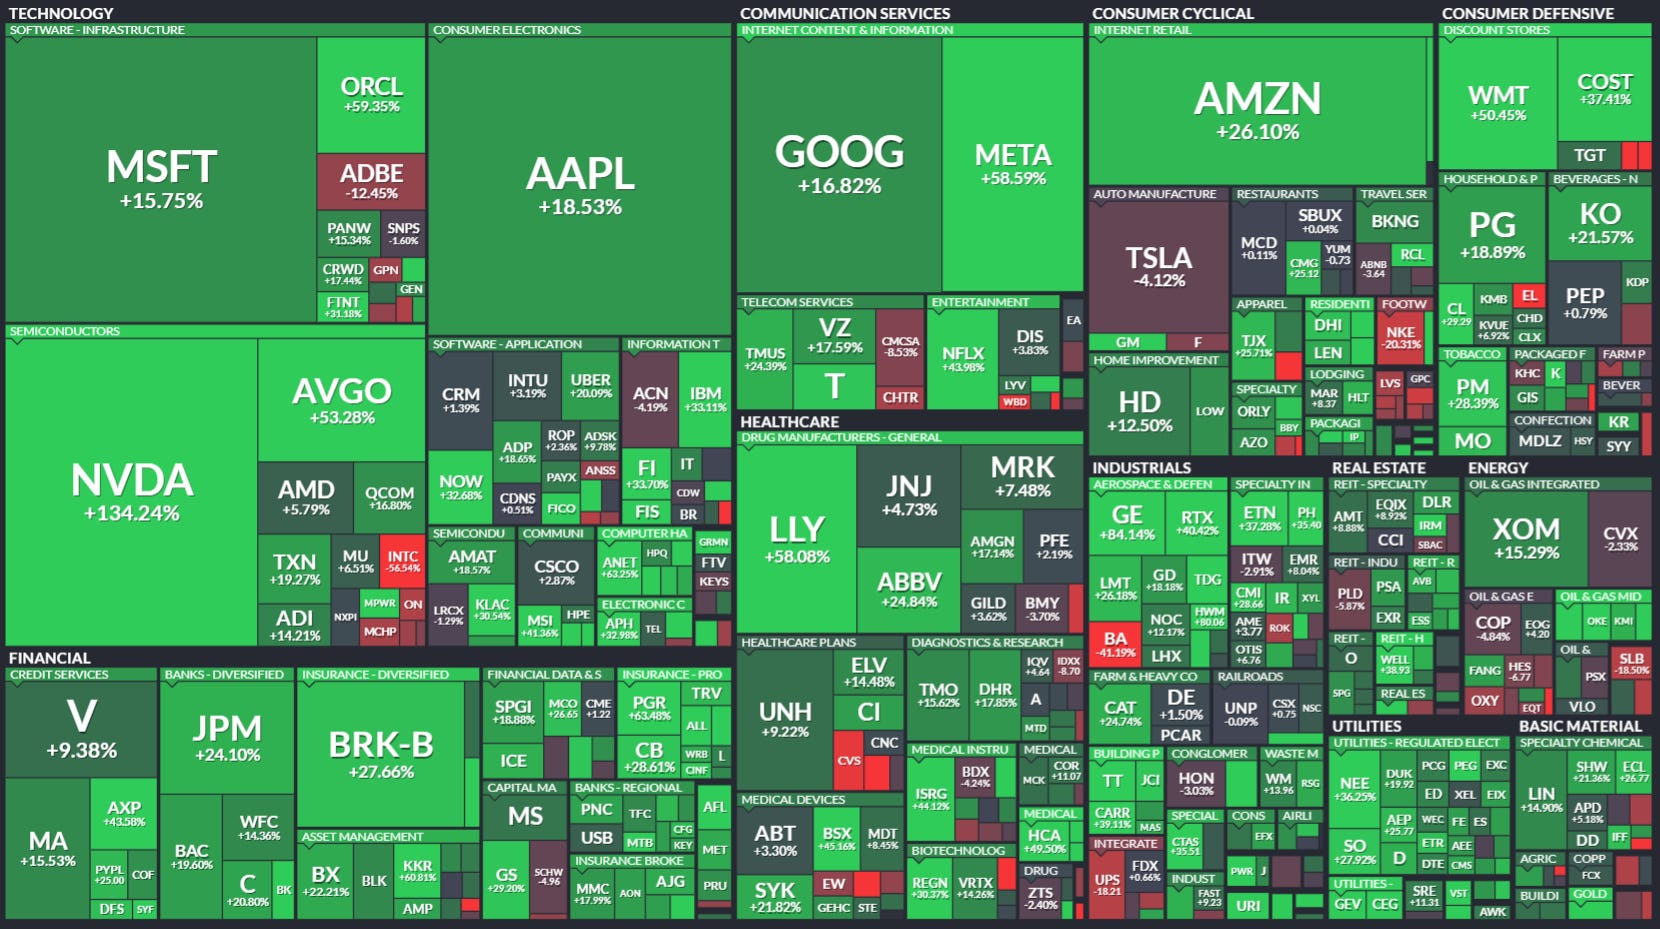
To cite some common arguments – I’ve extracted some graphs from currentmarketvaluation.com to prove the point.
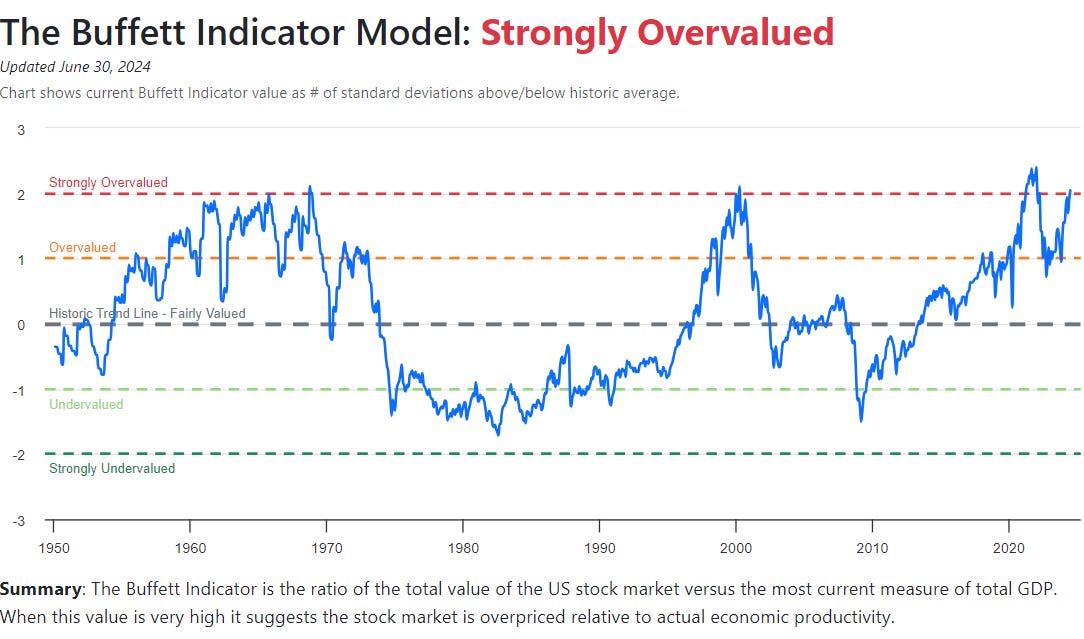
One of the commonly cited arguments is the Buffett indicator. It’s dividing the total US stock market value by the US GDP, and we’re currently sitting at 202% - which is approximately 63% above the historical trend line (which is around 2 standard deviations). From this indicator alone, it seems like we can tell absolutely that the US market is overvalued.
The further away it is from the historical trend, the greater your ability to estimate whether we’re overvalued or undervalued. In this instance, there were only 4 separate instances where we’ve reached that state – and in all 4 scenarios, the US market did not have a pretty ending. So is this time different?
I don’t know whether it would be different or not, but here’s my take.
I do believe that there is some logic behind this indicator – but I would propose that there are nuances that are not appreciated. Take, for example, using the Buffett indicator in 2024 versus that of the 1960s. For one, the global context and interconnectedness have shifted drastically over the 60 years. Globalization, supply chain, equity financing, business scale, and expansion have all developed in a different flavor.
Companies of today, are mostly deriving their revenue internationally. Dividing the stock market value by only the USA GDP might not paint an accurate picture of the state of the stock market – especially concerning how companies have evolved, which would naturally be reflected in their enterprise value. Therefore, this so-called baseline or historic trend line might be more of a distraction as it does not consider this evolution.
I would just like to emphasize again that, I’m NOT disagreeing that the US stock market might be overvalued. I’m just thinking about the usefulness and effectiveness of these indicators to support that view.


Another 2 common indicators include the P/E ratio and the mean reversion theory.
When looking at both, they seem to suggest a similar picture – the US market is overvalued. My thinking about this whole PE ratio thing is simple. If a company (or in this case, an index or portfolio of companies) exhibits superior earnings quality and growth aspect, they deserve to trade at a premium.
I’m not casting any judgment here – but it is a common consensus amongst most investing professionals, that the US market does comprise of one of the highest quality companies and mechanisms for such price discovery. Does it necessarily mean that they’re overvalued?
Maybe. But someone or something must prove that the emperor is not wearing any clothes. If not, then I believe the music will go on, since there are no better alternatives.
To steelman my argument, I would like to remind fellow investors that expected growth and stock returns are not related. There’s a misconception that if you invest in the highest growth country/sector/company means that you’ll outperform.
Expected growth is incorporated into the asset prices because the market is forward-looking. If growth comes in line as expected, performance will not be spectacular. If it comes in unexpected, then investment returns might come in as a surprise (both positive and negative).
All we can say now is that over the last one and a half decade, the US has performed exceptionally – in comparison to previous, earlier expectations. I believe we can safely say that a lot has already been priced in. Now, it’s up to them to show us if they can continue this exceptionalism.

From an earnings yield perspective, stocks are still okay – considering the 10-year Treasury alternative.
So the bottom line is – where do you stand?
Here’s where I stand.
I think I can concur that the stock market is probably not a screaming buy – at exceptionally undervalued territory. I’m not in that camp.
However, to shout at the top of my lungs, saying that valuations today are ridiculous, and the bubble is poised to burst soon… I’m not too sure either. I believe it’s hot – but maybe not a sure-win, to bet against it.
We do seem to be on track, for the bubble to balloon if more investors are convinced along the way that valuations and earnings do not matter.
On a personal level, however, indexing makes up a small percentage of my portfolio. I still focus extremely heavily on securities analysis and individual stock picking. Therefore, whether the overall index is overvalued or not should not matter much. However I must say that selecting stocks in the 2020 and 2022 environment is probably a tad bit easier.
However, I do air on the side of caution where I’m trying to conserve a little bit more cash, be more prudent with my allocation, and take bets more opportunistically. That said, I do believe in the idea that – when you have a hammer, every problem starts to look like a nail. In a similar sense, when you’re always hunting for value – there’s quite several opportunities, depending on whether you know how to look for them.
For one, I remain optimistic and bullish about the Hong Kong market, which offers securities with great discounts.
For those sitting on the sidelines – and even some, trying to time the market with their entire portfolio. I think that can be dangerous in the long run (especially if you start believing in the stories you start telling yourself, with all the reinforcement resources you can consume).
On a related note, around trying to time the stock market that is consistently hitting new all-time highs, I’ve got bad news. Research from Schroders has shown that the market is actually at an all-time high more often than you might think. Of the 1,176 months since 1926, the market was at an all-time high in 354 of them, 30% of the time.

On average, 12-month returns following an all-time high being hit have been better than at other times: 10.3% ahead of inflation compared with 8.6% when the market wasn’t at a high.
So what’s the conclusion?
Don’t be afraid of all-time highs. It might sound counterintuitive, especially when we’re taught from the start to always buy low and sell high. However, if you were to take a long-term view on an asset class like the S&P500, they tend to just trend higher over long periods of time, basically – buy high, sell higher.
For those (like me), that maybe focus a lot more on individual securities analysis, it should not matter whether the stock is at all-time highs or not – because we buy into value. There will always be some sort of mispricing somewhere, somehow – and our ability to discover them determines our payout.
I hope to see you on the other side.
Love,
Chi Keng